Quoting tool
Case study
Quoting any roof in the world in <5 minutes
A roof quote took 22 minutes, leaving customers waiting on the phone and putting deals at risk. Remi was producing more than 20,000 quotes a month, so every minute mattered. I redesigned the quoting workflow to bring quote time below five minutes, shifting agents from building quotes by hand to reviewing generated ones.
62% reduction in friction events
Reduced inputs, clicks and other unnecessary actions by 62%
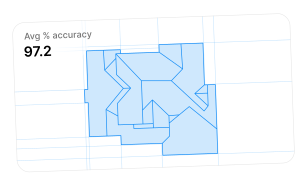
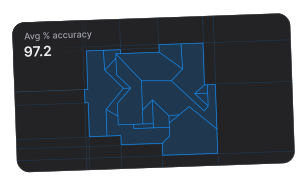
3.5% increase in accuracy
This equates to roughly $350 per project, or nearly $4 million in reduced float
Average time reduced from 22 min to 5 min
This improves cost per quote, projected headcount needs, and customer satisfaction
The Problem
Customers were ready to buy. Quotes took 22 minutes.
Customers
Customers waited on the phone with a salesperson for more than 20 minutes to receive a quote, putting the deal at risk before they even had a price.
Quotes per month
At more than 20,000 quotes a month, slow quoting meant customer wait time repeated and risked worsening at scale.
Accuracy cost
Measurement errors of 2–3% were already resulting in millions of dollars per year in discrepancies. Faster quotes also had to be accurate.
Existing Product
The tool was a Frankenstein.
Years of quick fixes had left agents navigating a clunky, inaccurate tool full of repetitive manual work. Customers waited while agents assembled each quote.
Users struggled with tedious and repetitive work
Research
Understanding the purpose of every movement and input
The Core Bet Broken Into 3 Parts
Creating quotes→Audit generated quotes

257 seconds
Clear hierarchy and flow
Interactions such as editing, multi-select, snapping, splitting, layering, and labeling are all necessary for nearly every quote. Making them intuitive was crucial.

494 seconds
Intuitive editing of generated models
We made the bet that being able to import the measurements and edit the errors, rather than draw from scratch, would be faster. This meant diving headfirst into interactions such as drawing, multi-select, snapping, splitting, and shortcuts.

303 seconds
AI jobsite insights
Many roofs came with 50-100 images and documents showing roof details, engineering reports, and photos of the worksite, often with conflicting information. Sifting through them and understanding what was correct took 25% of quote time.
Starting from scratch


Design and build a beta of each bet
It didn’t have to work in production, just enough to test quote times and accuracy.
Validate one variable at a time
Have a small portion of the quoting team use the new feature to see the change in time and accuracy.
Build iteratively
Assess and tweak as needed.
Bet one
Clear hierarchy and flow
Quoting multiple skilled construction trades anywhere in the US poses an incredible challenge. Users not only had to endure tedium, but remember hundreds of variable rules for each quote.
By working with finance and operations, we were able to find over 20 inputs that could be removed due to being redundant, deterministic in nature, or just inconsequential.
Before, all information lived at the same level. This meant for each part of the roof (a slope, edge, peak, etc) users had to select 10+ items. Not only was it inefficient, it caused a level of noise that affected accuracy. We needed to drastically simplify without granularity being degraded.
Proper information hierarchy
Trade → Structure → Section → Lines & Polygons. This eliminated the user’s most repetitive interactions.
Answer the big questions first
The higher the user was in the hierarchy, the more important (cost-sensitive) the information asked.
Bet Two
Intuitive editing of generated models
Polygon interactions
By auditing every interaction, it became clear that basic tools got 80% of the way there, but edge cases were so intense they heavily skewed the median. Because of this, we added tools like history, layering, point-snapping, angle-snapping, and keyboard shortcuts.
Visualizing unusual roof areas was also a challenge. Users were switching tabs to compare references side by side. We added an adjustable modal within the tool to make comparison as simple as possible.
In-view references: LiDAR & Google
Bet Three
AI that users can trust at a glance
The pipeline first processes every file. If the model finds content that matches a tag, it saves that content for extraction.
Then, an LLM runs structured data extraction for each tag, pulling relevant context from the tagged image and determining which information is most likely to be correct. I added the LLM's reasoning as well as a quick view of all the files to ensure the user had confidence in the decisions the model was making.
Results
From 22 minutes to under five.
Curveball
Within 90 days, the tool was in use in countries across the world.
Up Next
Estimated start week